


TSXV:OIII | OTCQX:OIIIF - O3 Mining
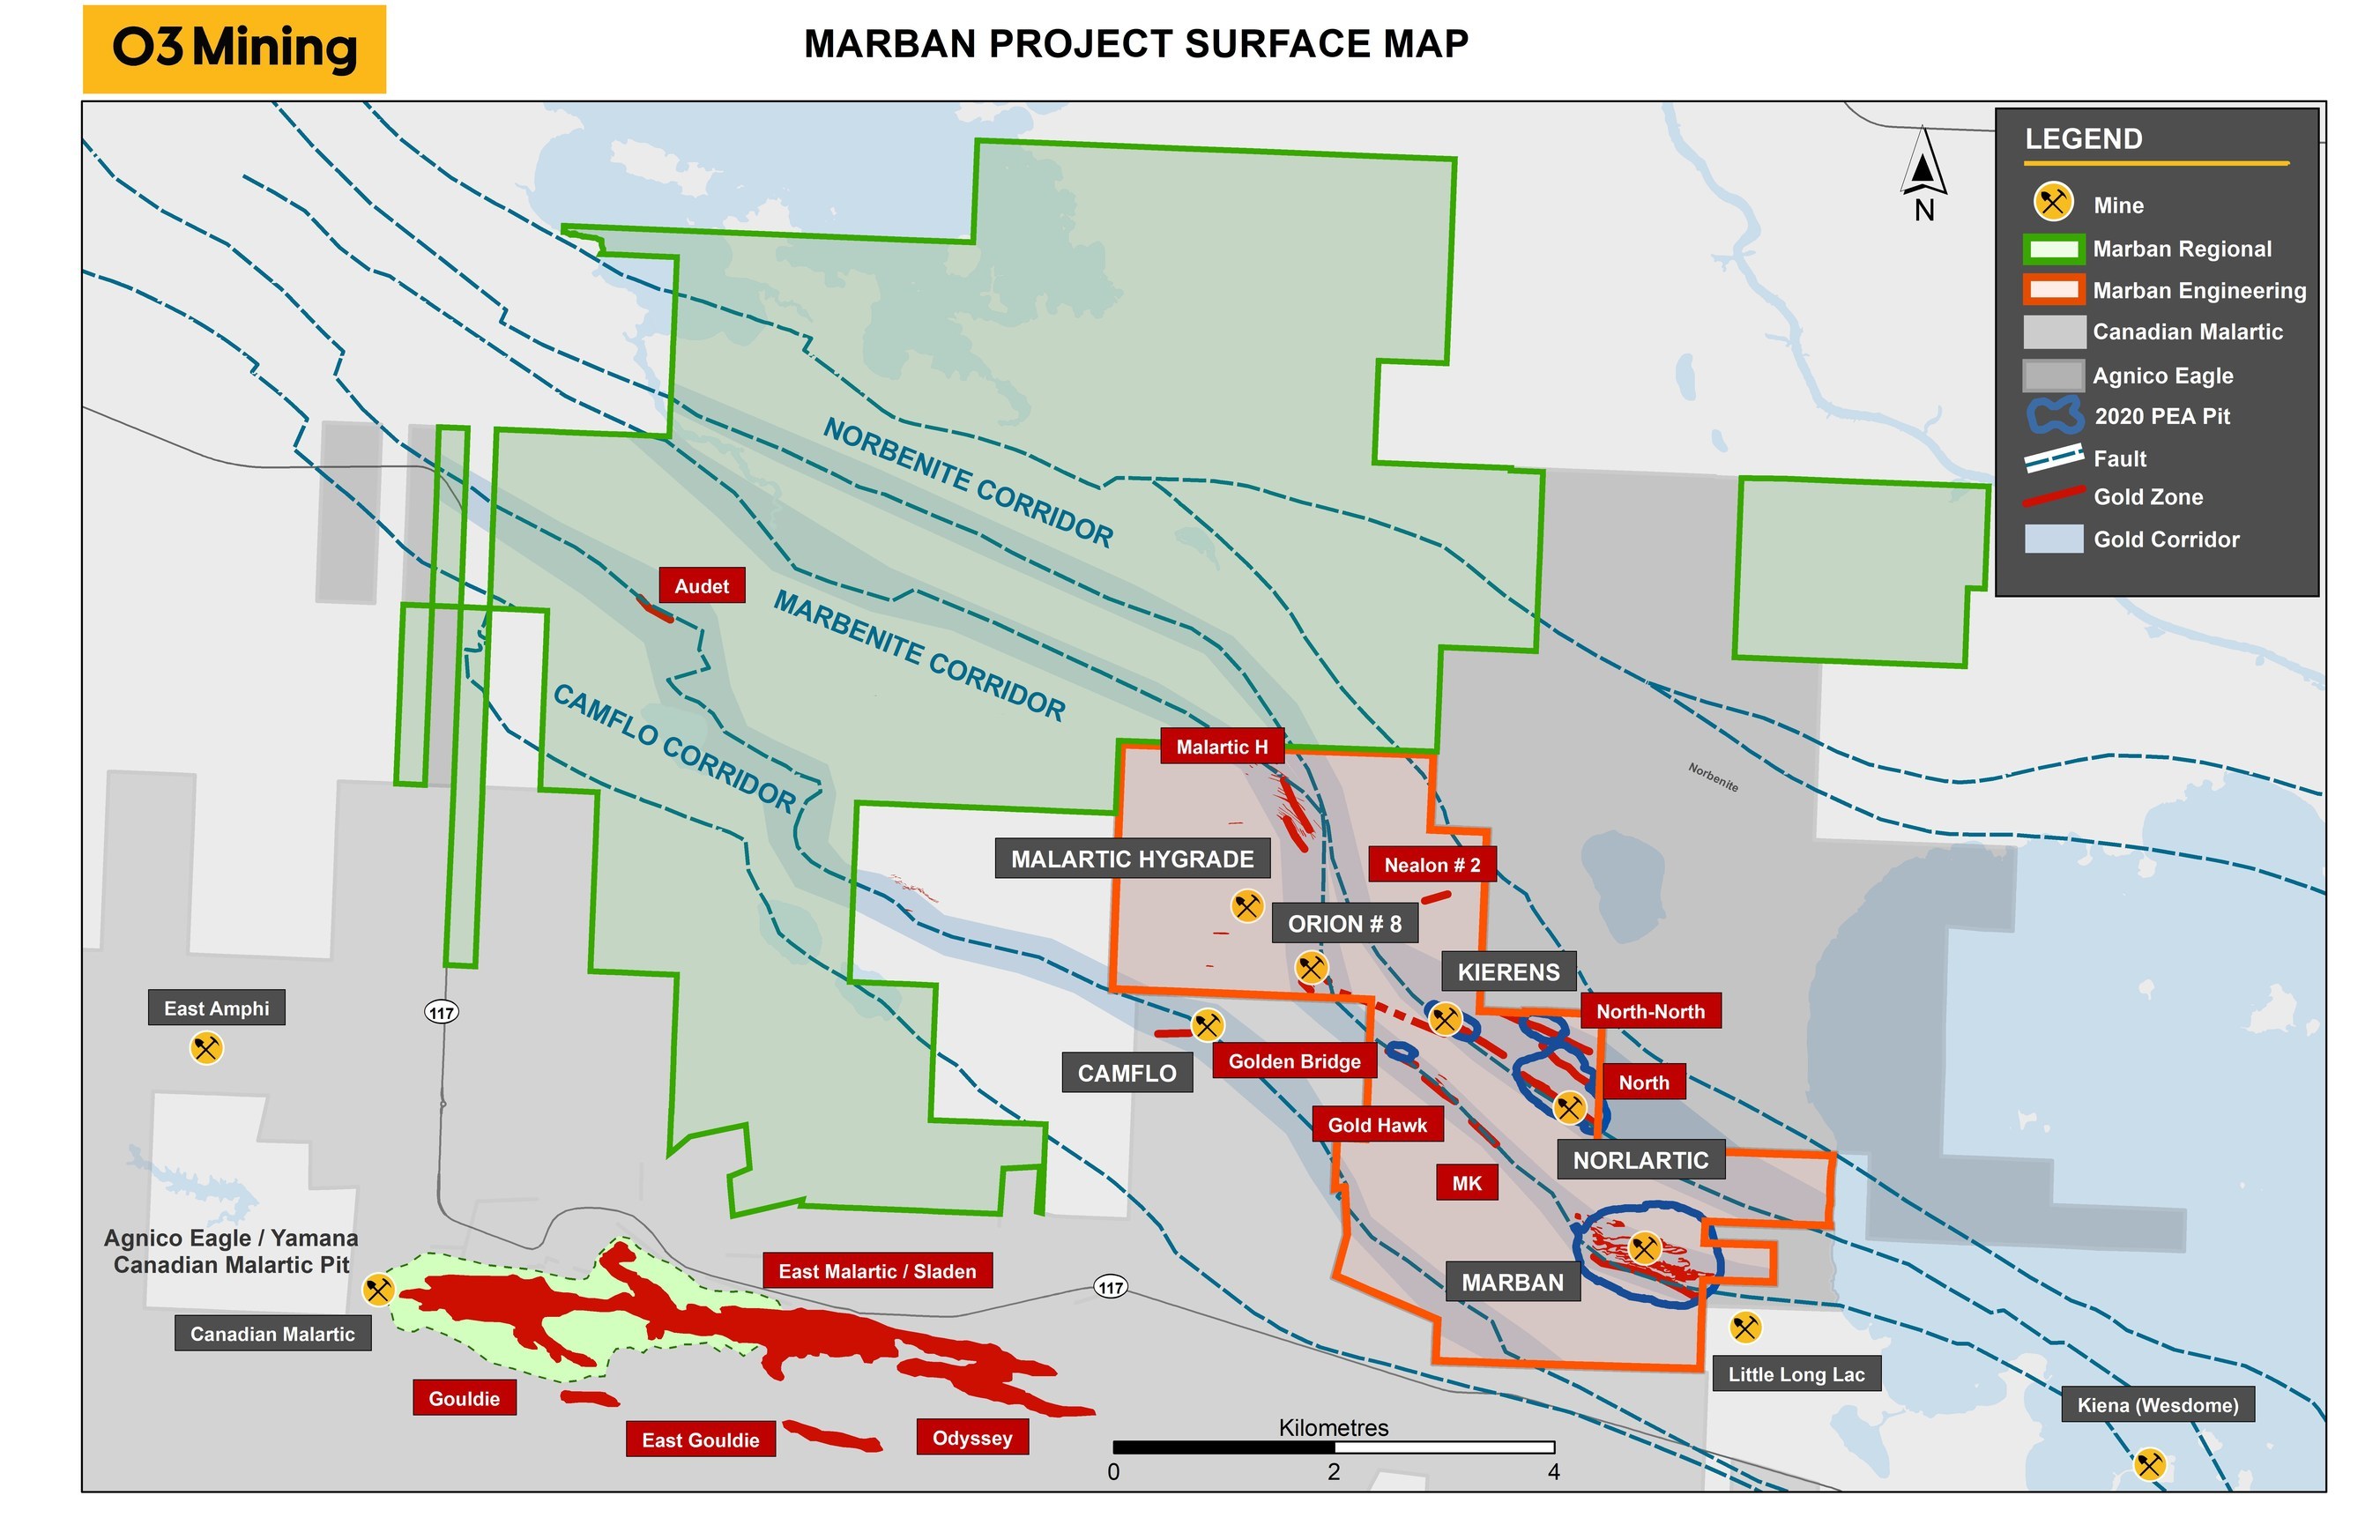
TORONTO, March 1, 2022 /CNW/ - O3 Mining Inc. (TSXV: OIII) (OTCQX: OIIIF) ("O3 Mining" or the "Corporation") is pleased to provide an updated Mineral Resource Estimate ("MRE") for its 100 percent ("%") owned Marban Project located in Val-d'Or, Québec, Canada. This MRE includes the results of 39,208 metres of infill and expansion drilling in and around the 2020 Marban Preliminary Economic Assessment ("PEA") pits.
Highlights
- Total Measured & Indicated ("M&I)" Open-Pit Mineral Resource of 2.3 million ounces of gold at an average grade of 1.07 g/t Au
- Increase in Open-Pit resources of 520,000 ounces (+29%) in the Indicated category, with an average gold grade increased by 2%.
- Conversion rate from Inferred to Indicated category is greater than 100%
- Kierens-Norlartic Open Pit M&I resources more than doubled from 2020 MRE
- Total M&I represents 91% of Total MRE
- 20,000 metres planned for Brownfield exploration to increase near surface resources at Marban Engineering
The updated mineral resource is estimated from 507,238 metres of drilling in 2,205 holes including 39,208 metres in 209 holes drilled by O3 Mining from March to December 2021. Most of the drilling was dedicated to infill drilling to convert inferred resources from the PEA to indicated resources, which will be used as a resource base for the upcoming Pre-Feasibility Study ("PFS") together with recently completed and reported metallurgical testwork results. The completed drilling succeeded to convert Inferred resources from the PEA to Indicated resources.
O3 Mining's President and Chief Executive Officer, Mr. Jose Vizquerra commented, "We are very pleased with the Marban resource update which successfully converted our inferred resources into indicated, with a conversion rate greater than 100%, which positions us well for the PFS to be completed later this year. Together with the recent metallurgical test work results and higher indicated resources, we are expecting to see robust economics in the Marban PFS and to move quickly towards initiating a Feasibility study. In parallel, initiating our 20,000 metres brownfield exploration program to increase near-surface resources and ounces at Marban Engineering."
The current drilling campaign on Marban Engineering will aim to expand the mineralization along strike to potentially generate future resources. The lateral extension of pits of the current resource estimates will be targeted, in particular, the two new pits generated north of the Marban main pit. Other zones not included in the current estimate will also be targeted such as Orion, Malartic Hygrade and Malartic H prospects.
Table 1: Marban Mineral Resource Estimate by Deposit
DEPOSIT | INDICATED | INFERRED | ||||
Tonnes (kt) | Gold(g/t) | Ounces (koz) | Tonnes (kt) | Gold (g/t) | Ounces (koz) | |
Marban – Open-Pit | 52,437 | 1.03 | 1,736 | 1,038 | 0.97 | 32 |
Kierens-Norlartic – Open-Pit | 14,795 | 1.22 | 582 | 1,068 | 1.42 | 49 |
Total Open-Pit | 67,232 | 1.07 | 2,318 | 2,106 | 1.20 | 81 |
Marban - UG | 162 | 4.47 | 23 | 860 | 4.43 | 123 |
Kierens-Norlartic - UG | 297 | 3.36 | 32 | 182 | 3.36 | 20 |
Total - UG | 460 | 3.75 | 55 | 1,043 | 4.25 | 142 |
Total – Open-Pit and UG | 67,692 | 1.09 | 2,374 | 3,149 | 2.21 | 223 |
Notes: See Marban Mineral Resources Estimate Notes further below. |
Table 2: Combined Marban and Kierens-Norlartic Open-Pit MRE Sensitivity Table
CUT-OFF | INDICATED | INFERRED | ||||
Tonnes (kt) | Gold (g/t) | Ounces Au (oz) | Tonnes (kt) | Gold (g/t) | Ounces Au (oz) | |
0.25 g/t | 71,111 | 1.03 | 2,353 | 2,308 | 1.12 | 83 |
0.30 g/t | 67,232 | 1.07 | 2,318 | 2,106 | 1.2 | 81 |
0.40 g/t | 59,327 | 1.17 | 2,229 | 1,879 | 1.3 | 78 |
0.50 g/t | 51,805 | 1.27 | 2,121 | 1,641 | 1.42 | 75 |
Notes: The above tonnages and grades are shown for comparison purposes only, and the reader should refer to Table 1 for the official resource tabulation. |
Table 3: Marban Open-Pit MRE Comparison – September 2020 vs February 2022
Resource Date | Gold Price | Cut-off | MEASURED & INDICATED | INFERRED | |||||
Tonnes (Mt) | Grade (g/t) | Ounces (Moz) | Tonnes (Mt) | Grade (g/t) | Ounces (Moz) | ||||
Sep - 2020 | 1,800 | 0.3 | 53.4 | 1.05 | 1.8 | 12.8 | 1.25 | 0.51 | |
Feb - 2022 | 1,900 | 0.3 | 67.2 | 1.07 | 2.32 | 2.1 | 1.2 | 0.08 | |
Difference | 13.8 | 0.02 | 0.52 | -10.7 | -0.05 | -0.43 | |||
Percentage | 26% | 2% | 29% | -84% | -4% | -84% | |||
The vast majority of this mineral resource estimate is covered by drill holes spaced 25 to 40 metres apart. The Marban MRE is based on 717 drill holes totalling 228,936 metres, of which 193,126 metres were assayed. The Kierens-Norlartic MRE is based on 1488 drill holes totalling 278,302 metres, of which 139,106 metres were assayed. Mineralized wireframes were constructed with the collaboration of the geological teams of O3 Mining and G-Mining Services to reflect the folded nature of the mineralization at Marban, and in accordance with the shape of the historical mining stopes and the historical underground mapping. Most of the mineralization consists of quartz – calcite – chlorite veinlets associated with disseminated pyrite, pyrrhotite and locally visible gold. Within the Marban pit and at the North zone, the mineralization is hosted within or near iron-rich basalts. Mineralization along the Kierens-Norlartic zones is hosted within or near an albitized and chlotitized intermediate dyke swarm. The North-North zone mineralization consists of quartz – tourmaline veinlets within a felsic albitized dyke.
The MRE is based on 29 domains in the Marban sector and 18 domains in the Kierens-Norlartic sectors. Interpolation algorithms are a mix of ordinary kriging ("OK"), Inverse Distance Squared ("ID2") and Inverse Distance Cubed ("ID3") depending on the grade continuity and available data in each domain. Outlier high-grade assays have been capped before compositing at 1.5 metres intervals, and capping grade has been defined by domain based on decile analysis and probability plots. Mineral Resource Classifications have been applied based on distance to drilling and estimation pass. In-Pit resources represent blocks above a shell defined by Whittle using a cut-off grade of 0.3 g/t using cost estimation similar to the PEA (Table 4).
Table 4: Parameters used to estimate cut-off grade – Marban and Kierens-Norlartic
OPTIMIZATION PARAMETERS | UNIT | VALUE | ||
Economic Parameters | ||||
Discount rate | % | 5.00% | ||
Gold price | US$/oz | 1,900 | ||
Transport & refining cost | US$/oz | 4.3 | ||
Royalty rate | % | 1.50% | ||
Royalty cost - Gold | US$/oz | 28.42 | ||
Net gold value | US$/oz | 1,867 | ||
Recovery & Dilution Factors | ||||
Average gold recovery | % | 93.70% | ||
Mining dilution (in block model) | % | 5.00% | ||
Mining loss (in block model) | % | 0.00% | ||
Other Ore Based Costs | ||||
Total Processing Cost incl. Power | C$/t milled | 14.5 | ||
General & administration costs | C$/t milled | 3.7 | ||
Total Ore Based Cost & Cut-Off Grade | ||||
Total Ore Based Cost | C$/t milled | 18.2 | ||
Gold Cut-Off Grade | g/t Au | 0.3 | ||
Mining | ||||
Total Mining Reference Cost | C$/t mined | 2.4 | ||
Incremental bench cost | C$/5m bench | 0.003 | ||
The MRE (with an effective date of February 27, 2022) was prepared by G-Mining Services Inc. The full technical report, which is being prepared in accordance with National Instrument 43-101 – Standards of Disclosure for Mineral Projects ("NI-43-101"), will be available on SEDAR (www.sedar.com) under the Corporation's issuer profile within 45 days.
Marban Mineral Resource Estimate Notes
- The Mineral Resources described above have been prepared in accordance with the CIM Standards (Canadian Institute of Mining, Metallurgy and Petroleum, 2014) and follow Best Practices outlined by the CIM (2019).
- The Qualified Person (QP) for this Mineral Resource Estimate is James Purchase, P. Geo of G Mining Services Inc. Mr. Purchase is a member of L'Ordre des Géologues du Québec (#2082).
- The effective date of the Mineral Resource Estimate is February 27th, 2022.
- The lower cut-off used to report Open-Pit Mineral Resources is 0.30 g/t Au. Underground Mineral Resources have been reported using a 3.0 g/t lower cut-off at Marban, and a 2.5 g/t lower cut-off at Kierens-Norlartic.
- The Marban and Kierens-Norlartic Deposits have been classified as Indicated and Inferred Mineral Resources according to drilling spacing and estimation pass. No Measured Resource has been estimated. Underground Mineral Resources have been categorized manually to remove isolated areas and have been reported using 3 metres minimum thickness.
- Known underground workings have been incorporated into the block model, and zero density has been assigned to the blocks located within the voids.
- The density has been applied based on measurements taken on drill core and assigned in the block model by lithology.
- A minimum thickness of 3 metres was used when interpreting the mineralized bodies.
- The MRE is based on subblock models with a main block size of 5 m x 5 m x 5 m, with subblocks of 2.5 m x 2.5 m x 2.5 m, and has been reported inside claim boundaries held by O3 Mining
- Tonnage has been expressed in the metric system, and gold metal content has been expressed in troy ounces.
- The tonnages have been rounded to the nearest 1000 tons and the metal content has been rounded to the nearest 1000 ounces. Totals may not add up due to rounding errors.
- These mineral resources are not mineral reserves as they have not demonstrated economic viability. The quantity and grade of reported Inferred mineral resources in this news release are uncertain in nature and there has been insufficient exploration to define these resources as indicated or measured; however, it is reasonably expected that the majority of inferred mineral resources could be upgraded to indicated mineral resources with continued exploration.
")
Qualified Person
The information pertaining to the MRE in this news release has been reviewed and approved by Mr. James Purchase, P. Geo. (OGQ #2082), Vice-President, Geology and Resources of G-Mining Services Inc. All other scientific and technical content of this news release has been reviewed, prepared, and approved by Mr. Sébastien Vigneau, P. Geo (OGQ #993), Principal Geologist of the Corporation. Messrs. Purchase and Vigneau are "Qualified Persons" as defined by National Instrument 43-101 – Standards of Disclosure for Mineral Projects ("NI 43-101").
About O3 Mining Inc.
O3 Mining Inc., an Osisko Group company, is a gold explorer and mine developer on the road to produce from its highly prospective gold camps in Québec, Canada. O3 Mining benefits from the support, previous mine-building success, and expertise of the Osisko team as it grows towards being a gold producer with several multi-million-ounce deposits in Québec.
O3 Mining is well-capitalized and owns a 100% interest in all its properties (137,000 hectares) in Québec. O3 Mining trades on the TSX Venture Exchange (TSXV: OIII) and OTC Markets (OTCQX: OIIIF). The Corporation is focused on delivering superior returns to its shareholders and long-term benefits to its stakeholders. Further information can be found on our website at https://o3mining.com
About G-Mining Services
G-Mining Services Inc. is a specialized mining consultancy firm based in Canada. We are an entrepreneurial minded and multidisciplinary company that offers a wide range of services to both underground and open pit mining projects from greenfield to operating mines. Our firm possesses the rare capabilities to develop a resource from the exploration phase, to development, into construction, commissioning and then operations.
Cautionary Note Regarding Forward-Looking Information
This news release contains "forward-looking information" within the meaning of the applicable Canadian securities legislation that is based on expectations, estimates, projections, and interpretations as at the date of this news release. The information in this news release about the transaction; and any other information herein that is not a historical fact may be "forward-looking information". Any statement that involves discussions with respect to predictions, expectations, interpretations, beliefs, plans, projections, objectives, assumptions, future events or performance (often but not always using phrases such as "expects", or "does not expect", "is expected", "interpreted", "management's view", "anticipates" or "does not anticipate", "plans", "budget", "scheduled", "forecasts", "estimates", "believes" or "intends" or variations of such words and phrases or stating that certain actions, events or results "may" or "could", "would", "might" or "will" be taken to occur or be achieved) are not statements of historical fact and may be forward-looking information and are intended to identify forward-looking information. This forward-looking information is based on reasonable assumptions and estimates of management of the Corporation, at the time it was made, involves known and unknown risks, uncertainties and other factors which may cause the actual results, performance or achievements of the companies to be materially different from any future results, performance or achievements expressed or implied by such forward-looking information. Such factors include, among others, risks relating to the restart of operations; further steps that might be taken to mitigate the spread of COVID-19; the impact of COVID-19 related disruptions in relation to the Corporation's business operations including upon its employees, suppliers, facilities and other stakeholders; uncertainties and risk that have arisen and may arise in relation to travel, and other financial market and social impacts from COVID-19 and responses to COVID 19. Although the forward-looking information contained in this news release is based upon what management believes, or believed at the time, to be reasonable assumptions, the parties cannot assure shareholders and prospective purchasers of securities that actual results will be consistent with such forward-looking information, as there may be other factors that cause results not to be as anticipated, estimated or intended, and neither the Corporation nor any other person assumes responsibility for the accuracy and completeness of any such forward-looking information. The Corporation does not undertake, and assumes no obligation, to update or revise any such forward-looking statements or forward-looking information contained herein to reflect new events or circumstances, except as may be required by law.
Neither the TSX Venture Exchange nor its Regulation Services Provider (as that term is defined in the policies of the TSX Venture Exchange) accepts responsibility for the adequacy or accuracy of this news release. No stock exchange, securities commission or other regulatory authority has approved or disapproved the information contained herein.
")
")
SOURCE O3 Mining Inc.
